SCROLL DOWN
TO EXPLORE MORE
Onboarding Survey
Onboarding Survey
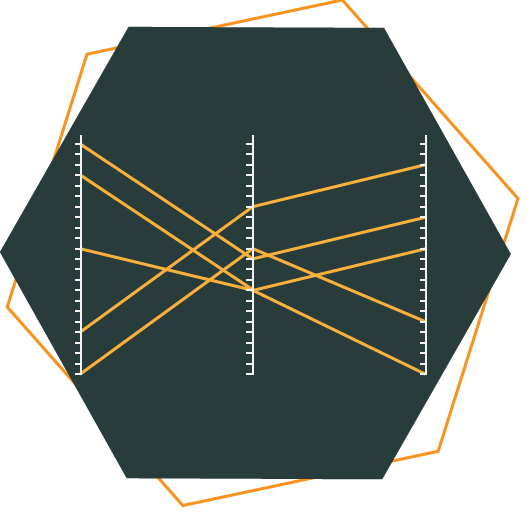
This parallel coordinates plot shows the relationship between the six attributes (cylinders, horsepower, weight, production year, and acceleration), for different cars.
1/10
Each vertical axis represents one attribute (e.g., acceleration).
2/10
Each line going trough all axes represents a specific car type (e.g., Mazda RX4) and its attribute values (e.g., Mazda RX4 has 6 cylinders).
3/10
Parallel lines between two adjacent axes indicate a positive correlation (e.g., more horsepower means heavier cars).
4/10
Crossing/intersecting lines between two adjacent axes (like an X-Shape) indicate a negative correlation (e.g., the higher the horsepower, the lover the acceleration (mpg)).
5/10
Placing two axes next to each other helps to analyze their relationship. For example, click on the header Weight (lbs) and drag it to the left of the axis Horsepower (hp).
6/10
Filter the data based on attribute values (e.g. ProdYear) by creating a box trough clicking-and-dragging at the same time over the desired value range (multiple-selections are possible).
7/10
The acceleration of the car Chrysler Valiant is 20.2 mph.
8/10
Maserati Bora has an acceleration of 14.6 mph, a horsepower of 335.0 hp, a weight of 3570 lbs, was produced in 1972, and has 8 cylinders.
9/10
The car Lincoln Continetal has a higher weight than the Lotus Europa.
10/10
The more cylinders a car has, the more Horsepower (hp) it has.
If you had a good understanding of the chart, please return to the survey window and close this window. Thank You!